The first weekend of March Madness is one of my favorite sporting events every year. Once the NCAA Men’s Basketball tournament tips off, these days for me are filled with exciting games, busted brackets, and Cinderella teams. Which team is going to go on a run for the championship and which players are going to have the “hot hand”?
If you like me enjoy watching sports, you have probably heard TV announcers or talking heads comment on a team’s momentum during a decisive part of the season or an individual player’s hot streak. As you are filling out your NCAA tournament bracket, you might encounter the following first round match-up between two similarly ranked teams: Team A is on a five-game winning streak. They will face off against Team B, who has lost their last three games. Who do you pick? Many of us might be inclined to pick Team A, because they have the momentum going for them. Makes sense, right?
Past versus future
When we assume that a team that has been on a winning streak will continue to win, we are implicitly assuming that recent performance is a good predictor of future performance. Teams having momentum going into a tournament, teams going on a run within a game, and a shooter having the “hot hand” in a game are all well-known phenomena to sports fans.
There is just one small problem – when researchers look for evidence for these phenomena in the date, they don’t find it! For example, researchers looked at free throw shooting by players of the Boston Celtics in the NBA during the 1980-1981 and 1981-1982 seasons, and were unable to establish a “hot hand” effect. Previous free throws did not appear to affect the likelihood of making the next free throw. The researchers also tested the theory of the hot hand in an experiment with Cornell University varsity basketball players. But even when removing the pressure of the game and the noise of the fans, they found no evidence for a “hot hand”.
In the book “Scorecasting”, the authors also discuss a variety of other studies that look at different types of momentum in sports. One study looked at runs by teams within a game, but did not find evidence that these runs increased the team’s chances of winning the game. Likewise, having won their last couple of contests did not significantly increase a team’s probability of winning their next game.
What does randomness really look like?
To figure out why the researchers’ finding are at odds with conventional sports wisdom, let’s take a little detour into psychology. It turns out that our human brains are constantly looking for patterns to explain events that we are seeing. Stuff just randomly happening is not something that most of us are very comfortable with. Moreover, we are not very good at describing what randomness looks like.
Here is an example: If you ask me to write out a random sequence of coin tosses (where “Heads” and “Tails” each appear with a probability of 50%), it might look something like this:
HTHHTTHTTHHHTHTHTHTTHHTHTT
Now compare this to a sequence created by a true random coin toss simulator:
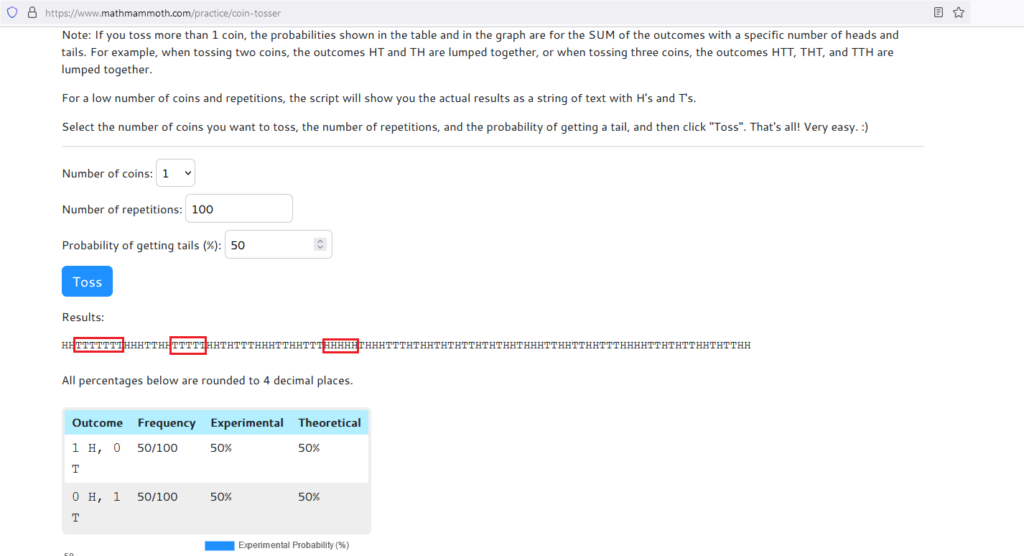
One thing that immediately stands out is that the sequence generated by the coin toss simulator contains streaks of seven times “Tails” in a row, five times “Tails” in a row or five times “Heads” in a row (highlighted with the red boxes). My “random” sequence is mostly bouncing back and forth between H and T, with at most three repetitions of either “Heads” or “Tails”. And it’s not just me – researchers have found in a variety of experiments that humans are not great at producing truly random sequences.
It can’t happen again – or can it?
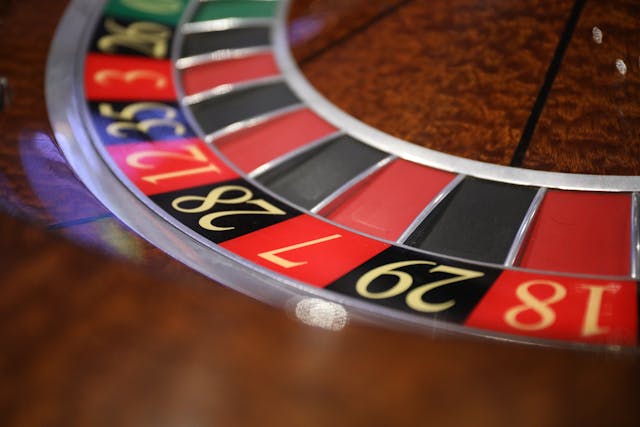
We can also observe our limited grasp on randomness in what is sometimes called the “Gambler’s fallacy.” Suppose two friends are playing roulette and the last five times “Black” occurred. Friend A thus exclaims “It’s gotta be “Red” next time!” Friend B carefully asks “But aren’t the chances for “Red” and “Black” (roughly) 50-50 each time?” Friend A, having taken a statistics class may years ago, replies with the following argument: “But see, the probability of six times “Black” in a row is only (approximately, ignoring “0”) 0.56 =0.015625, that’s 1.6%!”
While Friend A here is correct that the probability of six times “Black” in a row is only 1.6%, they are forgetting that this is also true for the probability of five times “Black” in a row and then “Heads”. Given that “Black” has already occurred five times in a row, the roulette wheel (unlike a human) doesn’t remember this and the probabilities of getting “Black” or “Red” are the same as on the first spin – roughly 50% each.
At this point you might be thinking “Ok, humans are bad at predicting random events. But I don’t gamble, and I don’t like basketball, so why does this even apply to me?” Well, the gambler’s fallacy rears its head in many different contexts unrelated to games of chance. For example, a loan officer might notice that they have approved quite a few applications in a row, while typically they have a rejection rate of 25%. Thus, they might be more likely to reject the next application to “correct” for this streak of approvals.
Fun and Games
Now where does this leave us? As we have seen, we seem to have some difficulties predicting future uncertain events. We look for patterns and use them to make predictions about the future, even though these patterns have no predictive power for what happens next. While I certainly don’t have the magic formula for picking the perfect March Madness bracket, I know one thing for sure – it is still one of my favorite times of the year!
If you enjoy thinking about sports, statistics and statistics about sports, become a Buff and take courses such as “Sports Economics” and “Business Statistics”!